Consumerism, in general, fascinates me. I'm always curious how people engage with products and the emotional valence behind those interactions. What about an object makes us actually feel something? Why and how is this important?
There's a lot of recent research indicating that we get more long-term joy out of experiences than we do from objects. At the same time, Marie Kondo has been wildly popular as of late, and her insinuation is that some objects do in fact spark joy. Not all of them, of course, but there are certainly some objects that we want to keep around. Ingrid Fetell Lee has a blog and recently wrote a popular book detailing characteristics of objects that bring us joy, such as color and shape.
Given this contrast, how can we better understand what products actually do cause joy rather than (or even, perhaps, in addition to) gather dust?

Data and Process
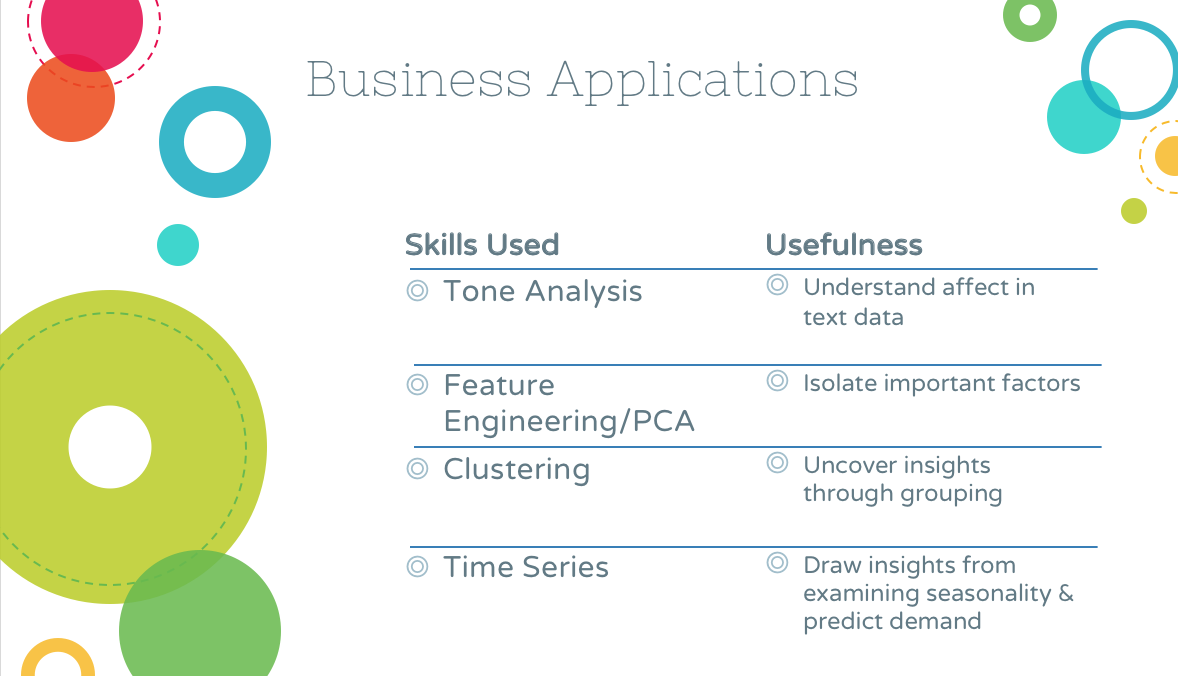
In order to address these questions, I analyzed 450 thousand Amazon product reviews. Tools I used included:
Through using tone analysis, I was able to label each review with a score for joyfulness as well as for several other emotional metrics.
I chose k-means clustering because this method made the most sense of my data. I came up with 8 clusters because this number both minimized inertia and was interpretable.
- Postgresql, SQL Alchemy to store and access data
- Tone analysis using the NRC Emotion Lexicon
- It was really important to me to use a crowdsourced lexicon since writers of reviews are a similar population and, thus, meanings of words from the two sources would be more likely to align
- Feature engineering and principal component analysis (PCA) to extract/condense the most important features
- Clustering (k-means)
- Time series analysis using Facebook Prophet
Through using tone analysis, I was able to label each review with a score for joyfulness as well as for several other emotional metrics.
I chose k-means clustering because this method made the most sense of my data. I came up with 8 clusters because this number both minimized inertia and was interpretable.
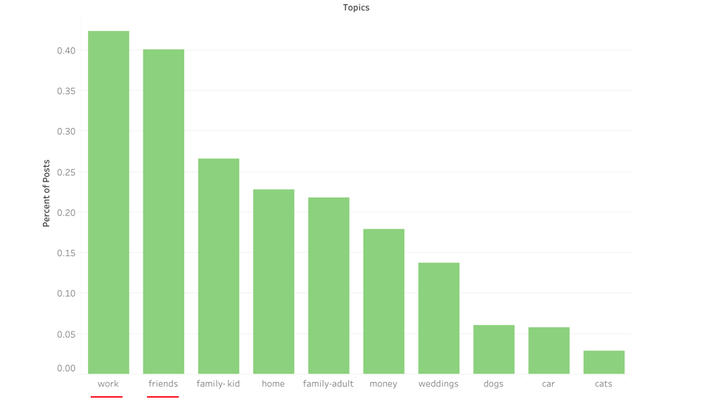
What Categories of Products Bring Happiness?
I was able to isolate a few categories wherein the reviews had higher joy ratings on average and a few categories that had lower joy ratings on average:
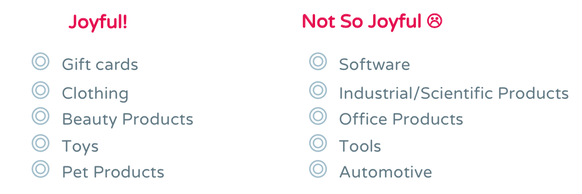
How might we interpret this? The more joyful categories are actually products that tend to be more experiential while the less joyful categories are more practical or functional. This aligns nicely with prevailing research about experiences bringing more long-term joy than possessions.
Relationship Between Star Rating and Joy
Ok, great. But-- I bet you're wondering about the one to five star rating that reviewers give a product.
Interestingly enough, there is...
Interestingly enough, there is...
What this might mean is that joy is actually a separate metric from star rating. It's pretty common to use star rating as a measure of customer satisfaction, and it is, but this analysis would indicate that it is not the only viable or interesting measure.
So what's the difference between them? Let's look at four categories:
So what's the difference between them? Let's look at four categories:
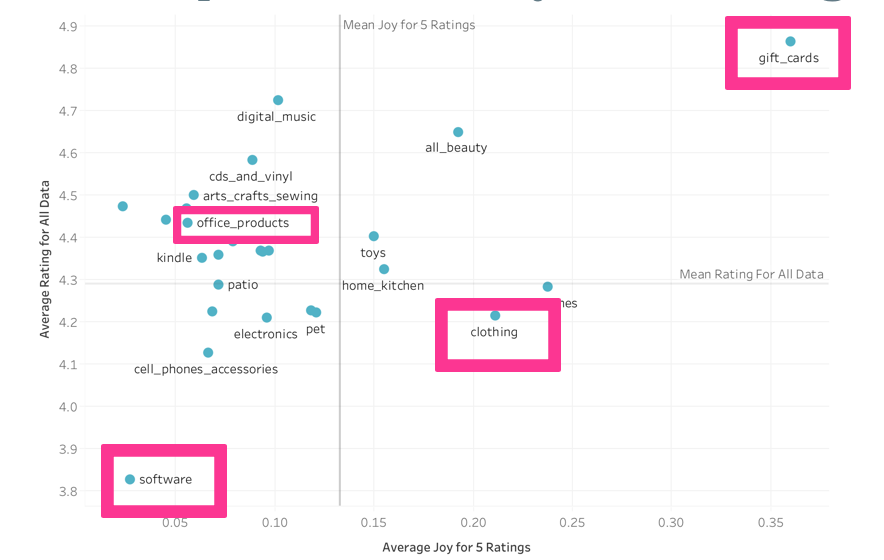
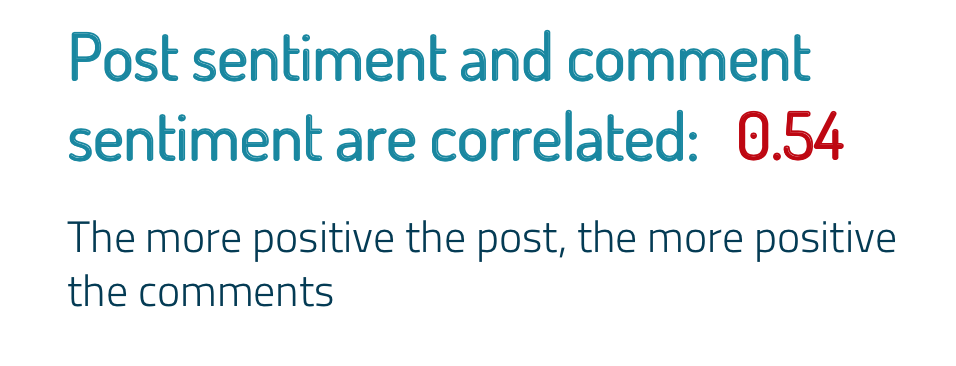
In this figure, average rating for all data is on the y axis and average joy score for ratings with five stars is on the x axis. (As indicated by the lack of correlation, categories had similar average joy scores regardless of rating).
First let’s start with gift cards— they’re high on both average joy and average rating. What I think this means is that people enjoy the experience of giving, the act of it, but also, they know exactly what the product is— their expectations are met, which I think is what the rating reflects.
Office products are relatively high on rating, but low on joy, illustrating that people are getting the function they expect (hence the rating), but they might not be optimizing for the experience.
For clothing, people are very joyful, probably because they get to wear something new and experience the item very viscerally, but the ratings are a bit low— we often order clothing items and they’re not really what we expected them to be (or at least that often happens to me!).
And finally, software is low on joy and on rating, which means that the software might not be exactly what we expected and, also, we are not enjoying the experience of using it too much.
So we’ve examined joy by category, but taking category out of the equation, how can we group products agnostic of category and, then, how can we see which products are joyful?
What Products Bring Happiness Agnostic of Category?
In order to investigate this question, I used PCA and clustered products.
My algorithm came up with eight clusters which I've labeled:
As you can see, my clusters are themselves clustered by gradation: the relatively happy reviews, neutral reviews, and unhappy reviews. Also worth noting is that this analysis was done on five star reviews, so there were less joyful sentiments even about products that were rated highly.
In order to delve further into what these clusters might indicate, I wanted to compare a couple reviews from the sad cluster (leaving aside the sad and disgusted cluster, which is getting at a bit of a different construct) and the very joyful cluster.
My algorithm came up with eight clusters which I've labeled:
- Very Joyful!
- High anticipation, joy, positivity, surprise, trust
- Medium Joyful
- Med anticipation
and med joy, high
positivity, high trust
- Med anticipation
- A Little Joyful
- Med joy, high positivity
- Med joy, high positivity
- Emotionless
- Low on all metrics
- Wrote a lot
- Low on all metrics, high
on review length
- Low on all metrics, high
- Not Thrilled
- Med negativity
- Sad
- Med fear, high negativity and sadness
- Sad and Disgusted
- Med anger and sadness, high disgust and negativity
As you can see, my clusters are themselves clustered by gradation: the relatively happy reviews, neutral reviews, and unhappy reviews. Also worth noting is that this analysis was done on five star reviews, so there were less joyful sentiments even about products that were rated highly.
In order to delve further into what these clusters might indicate, I wanted to compare a couple reviews from the sad cluster (leaving aside the sad and disgusted cluster, which is getting at a bit of a different construct) and the very joyful cluster.

How can we summarize these reviews?
For the sad cluster, these reviews basically say
"This thing did what I wanted it to do and there is nothing special about it."
On the other hand, for very joyful cluster, the reviews say
"This thing made me feel and experience in a different way."
In the second review for the very joyful cluster, the reviewers are discussing a plug, but there is something about the design of it, the experience of using it, and, in this case, I would assume the convenience of it, that is getting them all excited about the product to the point that they would actually recommend it to others.
One thing we can see here, beyond the fact that experience of a product seems to be at play, is that said experience is also informed by certain components of product design and the ways in which users engage with a product.
A Word on Seasonality
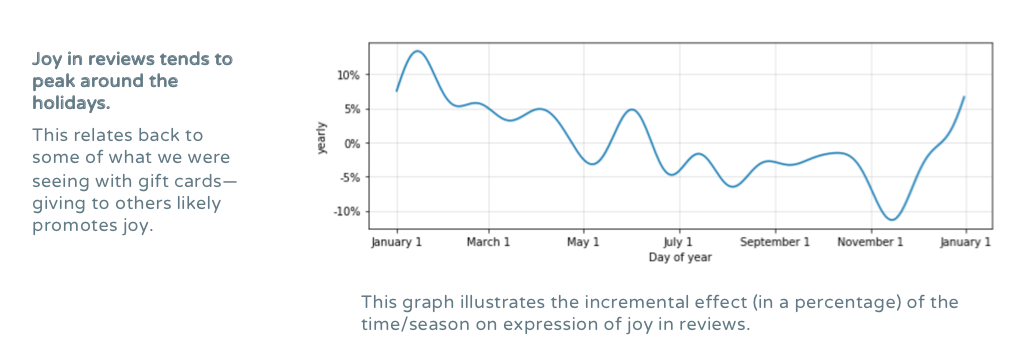
It appears that there is a certain confluence between giving and customer satisfaction as measured through joy. Preliminary topic modeling on reviews also indicated that the very joyful cluster had more language related to giving.
The further implication here is that what a customer actually does with a product matters. It's not just about the function that that product itself has, but about the emotional function the product has for the purchaser.
The further implication here is that what a customer actually does with a product matters. It's not just about the function that that product itself has, but about the emotional function the product has for the purchaser.
So What? Why is This Important?
Understanding consumer satisfaction using data that were not directly solicited from customers through surveys can inform UX research, can influence product design, and can contribute to crafting a more robust consumer strategy.
Consumer satisfaction can have all kinds of positive externalities for word-of-mouth advertising, brand image, and even repurchase behavior.
More broadly, the techniques I've illustrated here have broad business applications beyond this context and are likely to add value to any analytic process.
Consumer satisfaction can have all kinds of positive externalities for word-of-mouth advertising, brand image, and even repurchase behavior.
More broadly, the techniques I've illustrated here have broad business applications beyond this context and are likely to add value to any analytic process.

 RSS Feed
