|
For our classification project at Metis, I chose to look at data from the 2015 Nepal earthquake. While examining these data is important in general, it was also somewhat personal for me: I was in Kolkata at the time of this earthquake and actually felt it. Weeks later, I traveled to a friend's home (where I have been many times) on the border of Nepal.
Using data from DrivenData, I was hoping to differentiate buildings that were slightly damaged from those that were extensively damaged. If damage level could be predicted, it would help Nepal to plan ahead and to mitigate future damage in this earthquake-prone region. Here is a before image of a stupa in Nepal (on the left) and an after image (right). You can see that the earthquake truly was devastating in many locations.
|
Business Problem
In this analysis, I wanted to address two questions:
The clients I envisioned were an investing company interested in social entrepreneurship and the government of Nepal. The investing company would be interested in supporting industries that could fortify buildings and the government could offer subsidies and incentives for businesses and citizens to build or rebuild using better materials
- What can we do preemptively in order to minimize future earthquake damage?
- What can we prepare to do reactively when an earthquake inevitably occurs?
The clients I envisioned were an investing company interested in social entrepreneurship and the government of Nepal. The investing company would be interested in supporting industries that could fortify buildings and the government could offer subsidies and incentives for businesses and citizens to build or rebuild using better materials
Model
After trying out a variety of classification models (logistic regression, SVM, Naive Bayes, and more), a random forest model was the best at predicting whether a building would be significantly or minimally damaged (as measured by ROC AUC).
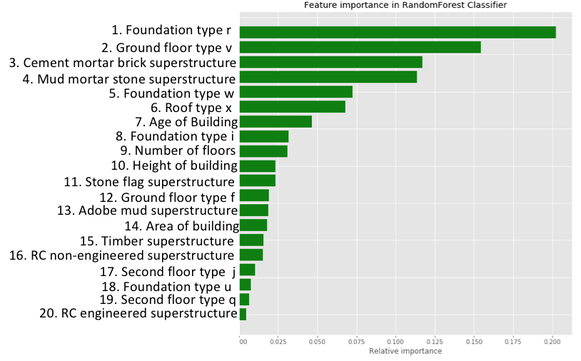
I began with 82 features and, using methods to determine which features were the most important, ended up with a model using 20 features.
I began with 82 features and, using methods to determine which features were the most important, ended up with a model using 20 features.
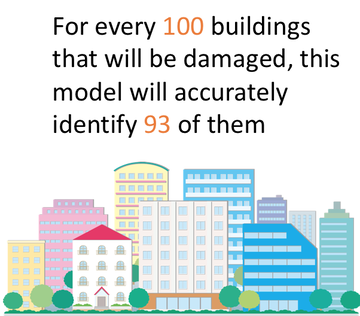
My model had an accuracy of 0.88, a recall of 0.93, and an ROC AUC of 0.82. In tuning my model, I wanted to prioritize recall, meaning that I would rather label buildings that would not be damaged as if they would be damaged than vice versa. This way, even if a building wouldn't ultimately be significantly damaged in another earthquake, the owners would have prepared as if it would be and would be safe rather than sorry.
A recall of 0.93 also means that...
A recall of 0.93 also means that...
Finally, I should also note that though I had geographic data for each building, I didn't use it in my model, because I wanted the model to be generalizable to other earthquakes. Though perhaps damage by region would reflect something specific about fault lines in Nepal, my hope is that my findings would be more widely applicable. Thus, the features in this model relate only to the characteristics of the buildings themselves.
Insights
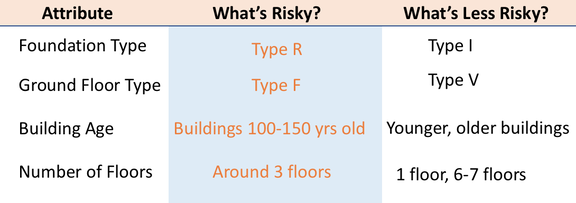
Through looking at different features, I found that foundation type, ground floor type, building age, and number of floors were particularly important in predicting whether a building would be minimally or significantly damaged. Unfortunately, my dataset obfuscated what the specific foundation and ground floor types were, but I was able to discern more specific information about building age and number of floors.
"Ave Pred Proba" below refers to the average predicted likelihood of significant damage for that foundation type or number of floors. This interactive visual was made with Tableau.
"Ave Pred Proba" below refers to the average predicted likelihood of significant damage for that foundation type or number of floors. This interactive visual was made with Tableau.
Recommendations |
Preemptive Recommendations
Given what we've found, there's a lot that the investing company and the government of Nepal can do ahead of time to mitigate significant damage in the event of another earthquake. The most impactful thing they could do would be to fix buildings with risky attributes now. Additionally, they could support new builds using less risky materials through subsidies and investments. Further work could be done to determine exactly how risky or not risky a given material might be.
Reactive Recommendations
Of course, you can never plan for all of the damage that might occur, and there might still be a fair amount. What the government can do is to know which regions are particularly at risk. Assuming fault lines would be consistent across earthquakes, some regions would be more likely to be hit than others. My data detailed 31 regions, which are shown below in terms of likelihood of damage.
The first figure shows average likelihood of damage overall by region, the second shows the average age of buildings (which we found to be a relevant feature) by region, the third figure shows the average area of the building by region (larger buildings were more likely to incur damage), and the fourth figure shows the average number of floors by region.
This interactive visual was made with Tableau.
I hope to be in or near Nepal again soon. It's a beautiful place at high risk, and is certainly worth striving to preserve.
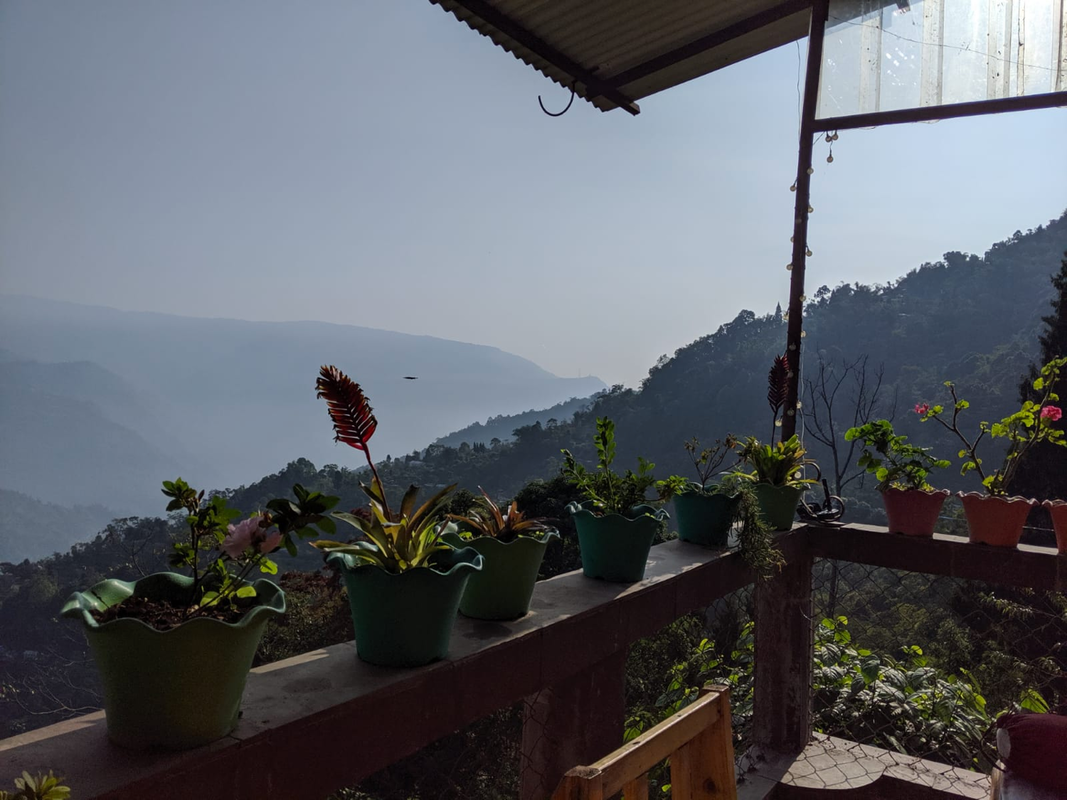
Here is a view from my friend's house:


 RSS Feed
